
How One Multi-Location Business Scaled From 8 To 60 Locations
Dear Operator,
Here's the truth. If you can't answer these questions with certainty, and you’re relying on unreliable spreadsheets:
Which locations actually generate profit (not just revenue)
More Importantly, how they make it, and how they lose it
➔ Which teams/managers drive real results, and which fall behind
➔ Which products/services drive real profit, not just sales
➔Where you're quietly bleeding money through overstaffing, wasted ads, or inefficient inventory?
➔ Who your most loyal and valuable customers are and how to keep them coming back
Then you're likely losing money in ways that won't show up until month-end... if at all
What follows is the same visibility-driven approach used by Private Equity firms to grow the companies they acquire.
This is how an 8-location business scaled to 60 by gaining full visibility across locations, without relying on inaccurate, time-consuming spreadsheets
Whether you're in healthcare, retail, manufacturing, service, membership businesses or any industry running multiple locations... What follows applies to you.
By the end of this page you'll know exactly how it works, and how to apply it to your own locations
Or if you'd rather see how it looks like for your business -
When we first stepped in, the operator had been running it for years.
8 locations. Revenue was steady. Customers were walking in. Costs looked “manageable.”
On the surface, it looked healthy
But they couldn’t answer those basic questions...

The Result?
"Busy" locations bled money through invisible staff performance, wasted stock, delayed reports and gut-feel decisions like where to cut costs or expand... Growth stalled. Leaders wanted to scale, but every move felt like a risk they couldn’t measure.
That’s because they were looking at each system separately:
Sales data shows revenue, but not profit
Accounting shows totals, but not which branch or product /services makes money.
Inventory alone shows stock levels, but not which items truly drive profit
Payroll alone shows cost, but not if staff are actually productive
We didn't accept fragmented views or inaccurate, time-consuming spreadsheets.. So we connected the systems behind them — automatically, updating in real-time:

Sales + Accounting:
Revealed which services/products actually make money

Sales + Marketing:
Proved which campaigns create profitable customers
Sales + Payroll:
Showed revenue per labor hour. Who’s a star and who drags you down

Sales + Inventory:
Flagged stock that moved vs. stock that died on shelves

Sales + Customer Data
Spot loyal customers,
why they buy, and how to keep them
Alone, each system is a clue. Together, they tell the whole story
You can of course try to manually combine them in a spreadsheet. But each time you do, it costs you or your manager time and money they could be spending on things that actually move the business forward.
And even then, one broken formula, one miscategorized entry, one tab someone forgot to update and the numbers you're making decisions on are wrong without anyone knowing it.
Once the data are connected and is finally in one place, that changes.
Key Operational Questions Get Answered In Seconds, Not Weeks :
"Which locations bled profit last month — and why?"
✅ Identify the leaks before they compound.
"Which locations improved month-over-month, and what drove it?"
✅ Know exactly which initiatives worked and which didn't.
"Which teams delivered the most last quarter?"
✅ Lead with accountability, without micromanaging.
"Which products or services drove the most profit last month... and who bought them?"
✅ Double down on winners, cut what's dragging margins down.
"How did we perform vs. last year? Did the initiatives we implemented drive real results?"
✅ Stop guessing whether your decisions are working.
"Which manager's location consistently outperforms... and what are they doing differently?"
✅ Identify your top performers, model their behavior, and raise the bar across every location.
"Are our top-spending customers from 12 months ago still buying... or quietly churning?"
✅ Protect the revenue you've already earned.
Stop guessing. Start knowing. See what your data’s been hiding in a 30-minute Free Audit
Before this, spreadsheets ran the business.
Five versions.
Twelve tabs.
Endless “final_final_v3.xlsx” files.
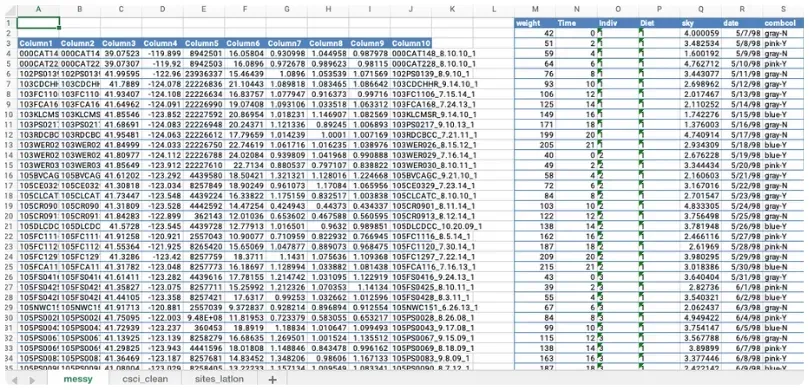
Every manager had their own numbers, and formulas broke. Reports arrived late, data was incomplete or inaccurate. And by the time discrepancies were discovered, money was already lost.
Instead of chasing files, We connected all the data from their scattered systems into one place. Sales, payroll, inventory, and costs finally talk to each other... automatically updated daily, and required zero manual assembly from their team.
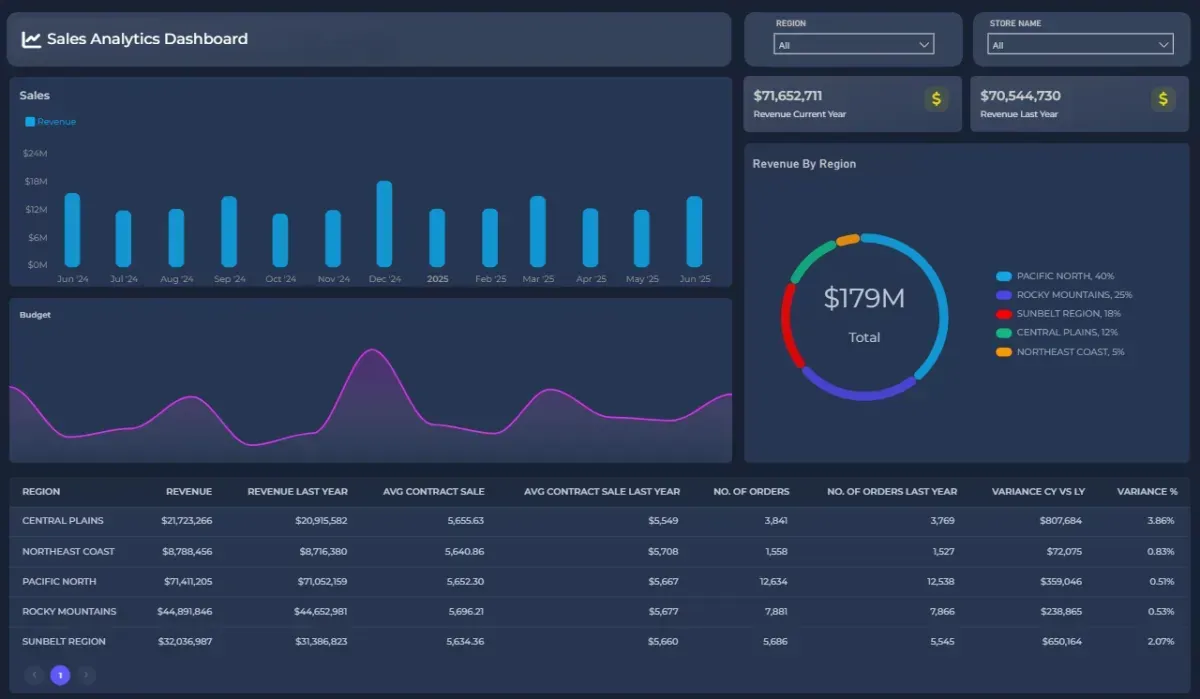
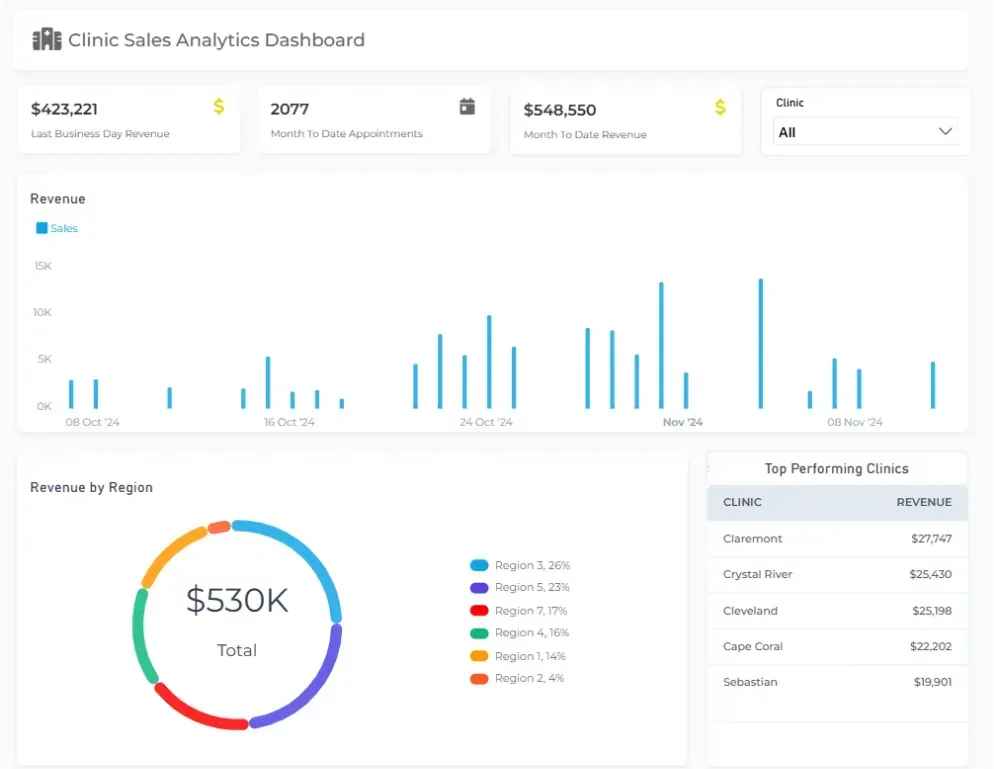
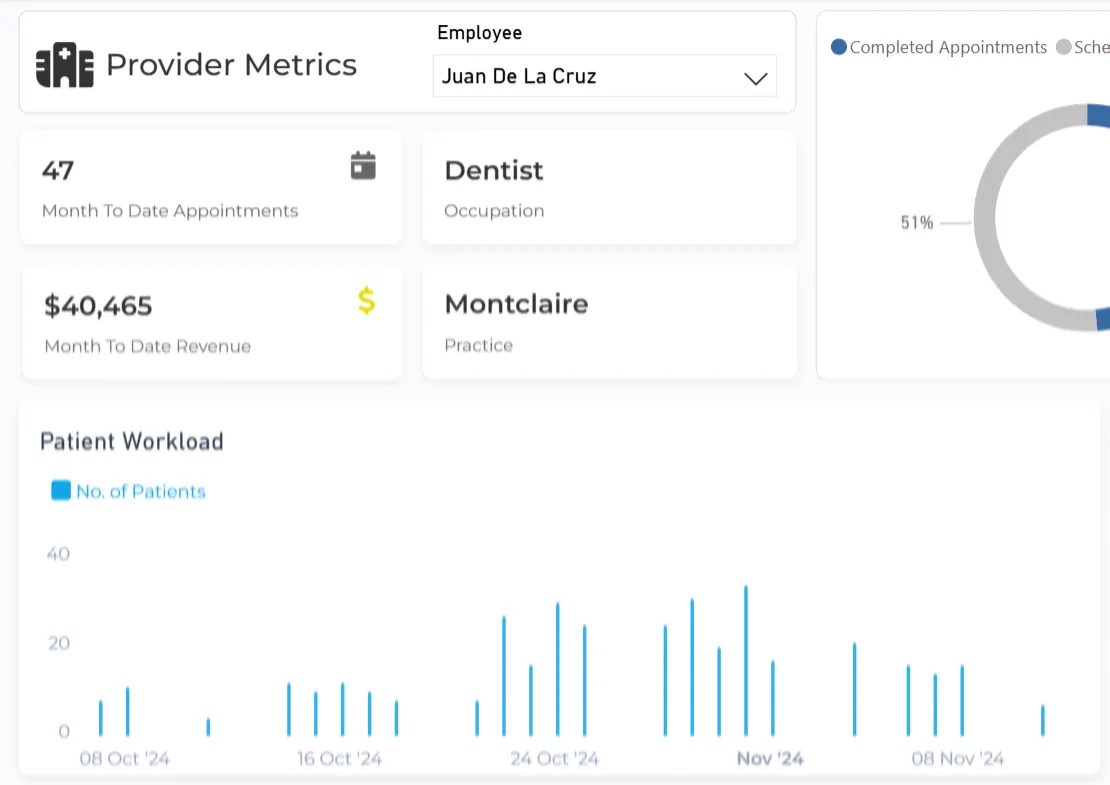
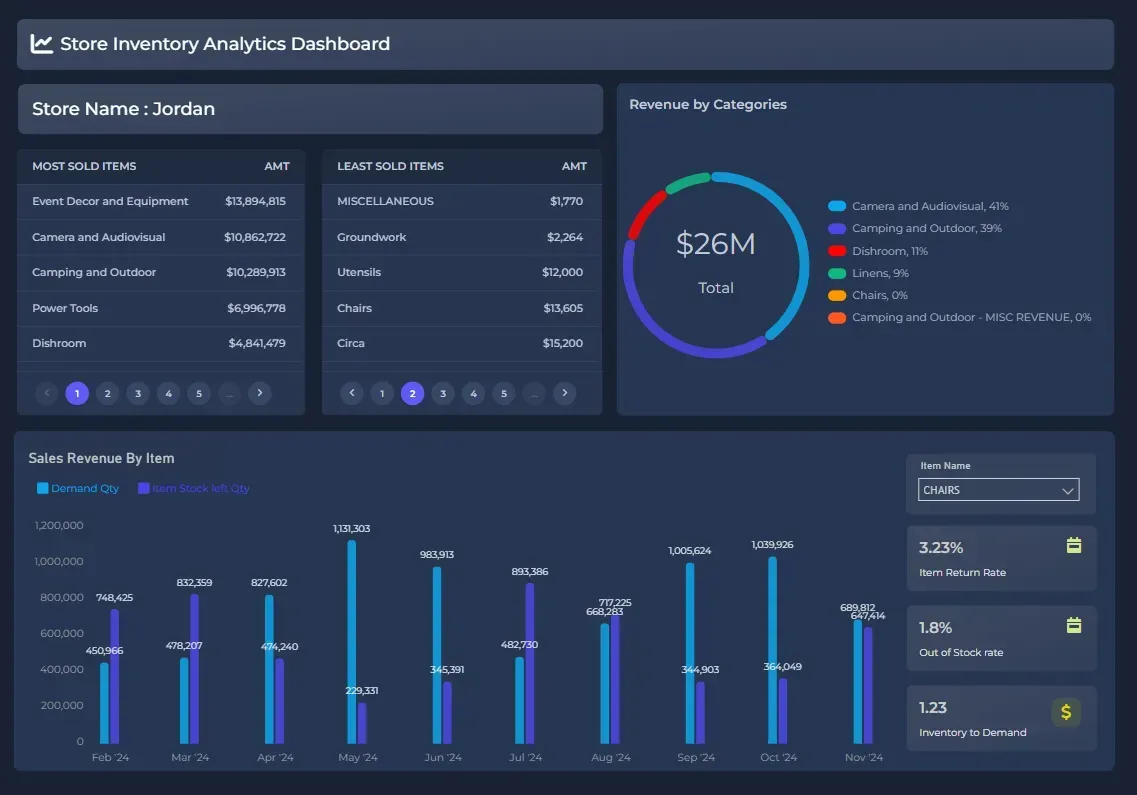
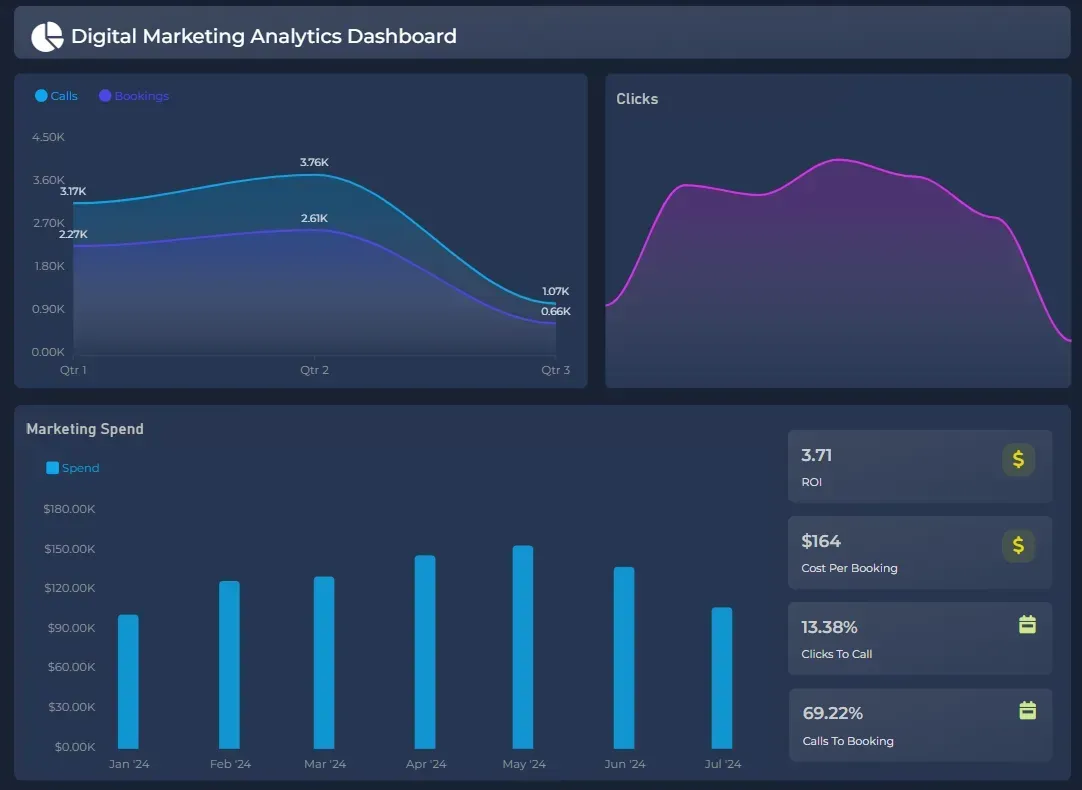


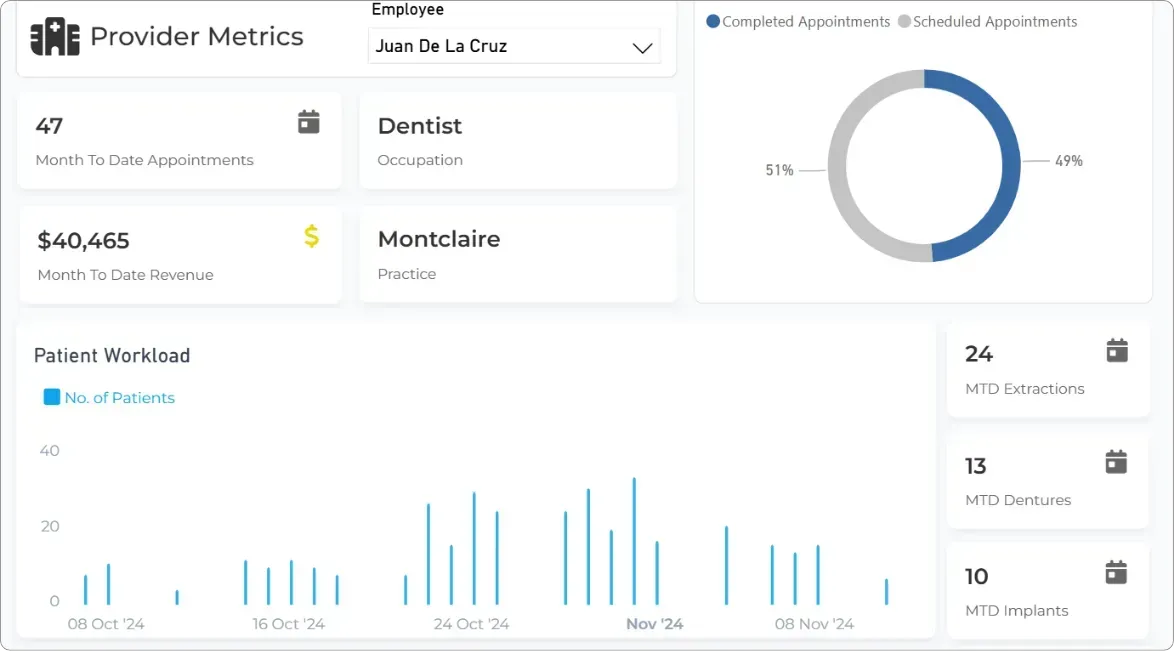
Sample dashboards used by clients.
Data has been anonymized and modified for security
For the first time, the systems stopped arguing.
They started aligning. Sales, payroll, inventory, and costs finally talk to each other Suddenly, they could see in real-time:
Which locations were truly profitable.
Which teams/staff were performing or underperforming.
Which sites were overstaffed or understaffed.
Which products or services deserved expansion.
Control returned, and decisions became deliberate:

New locations were modeled
after the proven profitable ones

Top-performing products and services were scaled aggressively across locations

Underperformers were coached or reassigned, raising the bar across the board

Staffing levels were adjusted to match real demand, cutting waste without hurting
That shift from reacting to commanding — is what changed everything.
That’s when the business started operating with visibility
Scaling Without Fear
With real control, expansion stopped being guesswork and expansion
came with confidence knowing they have full visibility :

The result?
8 locations became 60.
And the same method works for various industries like clinics, retail, manufacturing — replicate the winners, fix or close the losers.
Small Wins That Stack Into Millions
You don’t need to triple your size to feel the impact.
Even tiny tweaks created big results:

Paying closer attention to top-spending customers and
tailoring offers to them increased monthly cash flow.

Moving ad spend away from ineffective campaigns saved
$15k in one quarter

Adjusting staff schedules cut labor costs by 12% — no layoffs

Reassigning one underperforming employee boosted
margins by $8k a month
Stack these wins across multiple locations, and hundreds of
thousands in annual savings become millions as you scale.
What This Means for You
You don’t need a billion-dollar firm behind you.
Whether you've got 3 stores, 10 restaurants, or 20 service locations, your data already knows the truth
The question is: are you using it?

Do you know which locations, products or services are profitable after costs?
Can you spot your star staff — and your underperformers?
Are your ads creating paying customers or burning cash?
Are you making business decisions based on facts or gut feel?
If the answer is
“I don’t know,”
You’re Gambling.

Every Month You Wait, You Waste Potential
Scaling from 8 to 60 wasn’t luck.
It was Visibility.
The Framework didn’t just save money.
It gave confidence, confidence to invest, to
expand, to cut losses, and to double down on
winners.
The Framework didn’t just save money.
It gave confidence, confidence to invest, to expand, to cut losses, and to double down on winners.

